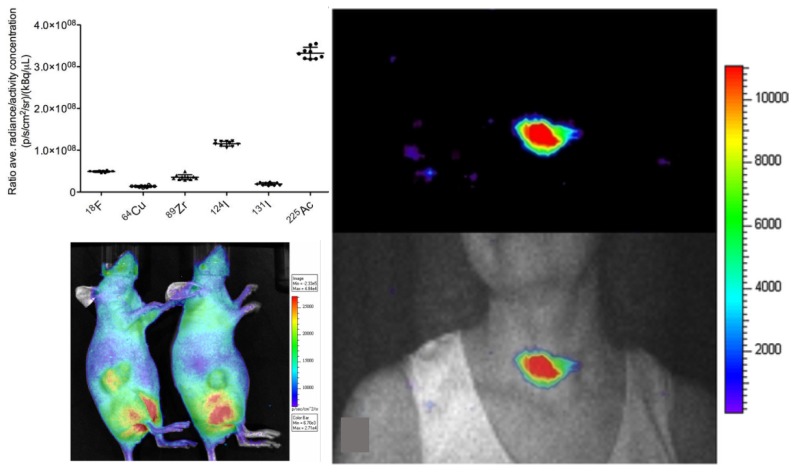
Fig. 1.
The relative CLI yield for different isotopes is shown in top left [13], and one of the first images observed from a mouse using CLI [8]. Soon after this, the first CLI image from a human was taken, shown (right-top) and its fusion on photographic image of the patients neck (right-bottom) to show the location of the intensity in the thyroid [53].

