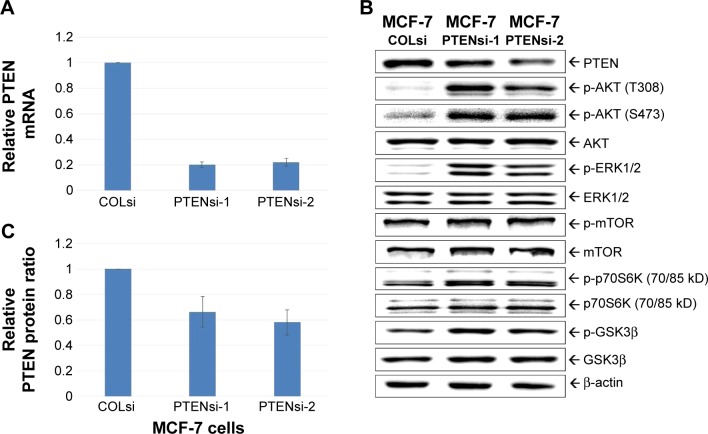
Figure 1.
Knockdown of PTEN in MCF-7 cells.
Notes: (A) Quantitative PCR analysis of PTEN mRNA expression in MCF7-COLsi, MCF7-PTENsi-1, and MCF7-PTENsi-2 cells. Box (B) A Western blot to show PTEN and the downstream gene expressions in MCF7-COLsi, MCF7-PTENsi-1, MCF7-PTENsi-2 cells. (C) Quantitative Western blot result of PTEN expression in MCF7-COLsi and MCF7-PTENsi cells. Data were presented as the mean ± SD (n=3). The experiment was repeated three times.
Abbreviations: PTEN, phosphatase and tensin homolog; PCR, polymerase chain reaction; SD, standard deviation.

