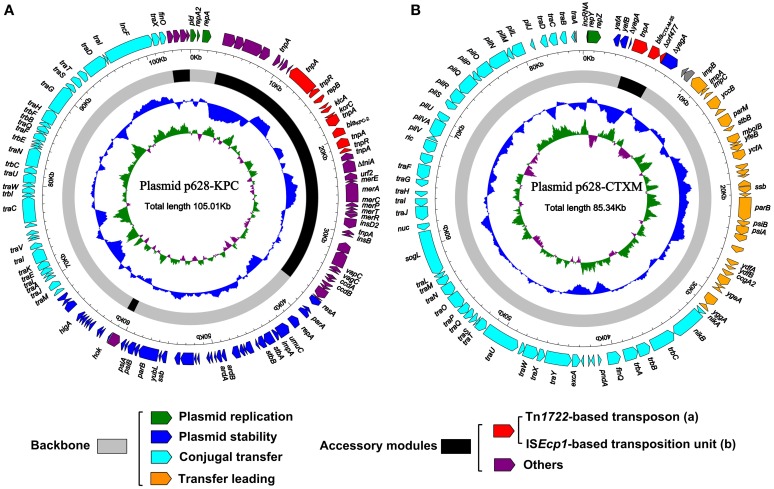
Figure 1.
Schematic maps of p628-KPC (A) and p628-CTXM (B). Genes are denoted by arrows and colored based on gene function classification. The innermost circle presents GC-Skew [(G-C)/(G+C)] with a window size of 500 bp and a step size of 20 bp. The blue circle presents GC content. Shown also are backbone and accessory module regions.

