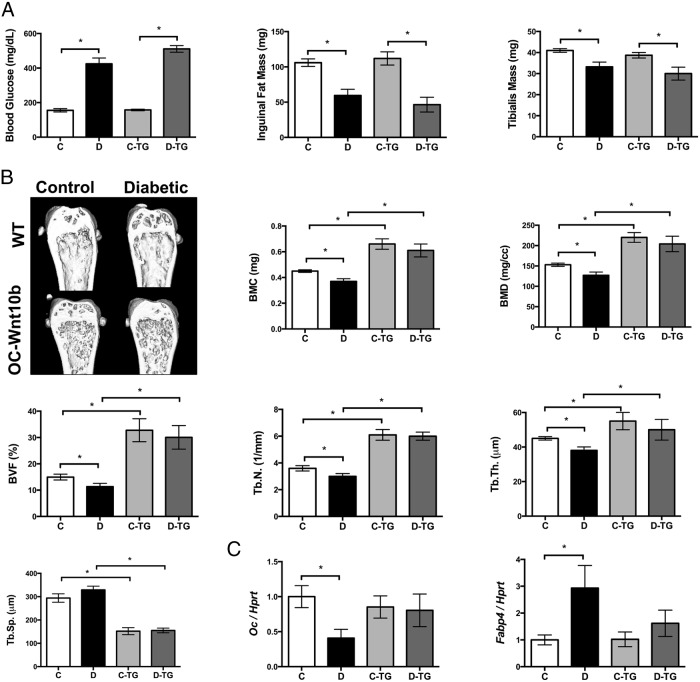
Figure 6.
Wnt10b TG mice do not display T1D bone loss and marrow adiposity. A, Random-fed blood glucose levels, fat pad mass, and tibialis mass measured in control (C) and diabetic (D) wild-type (WT) and Wnt10b TG mice. Values are averages ± SE (n = 10 per group). *, P < .05 compared with untreated control mice. B, Representative μCT isosurface images of trabecular bone volume/total volume from distal femurs are shown. Average ± SE (n = 10) bone volume fraction (bone volume/total volume) and other trabecular measures of the distal femur. BMC, bone mineral content; BMD, bone mineral density; T.N., trabecular number; Tb.Sp., Tb.Th., trabecular thickness. C, Expression of OC and FABP4 were measured in the tibia bone using real-time PCR. HPRT was used as a housekeeping gene to normalize the RNA expression. Bars represent averages ± SE (n = 7–8 per group). *, P < .05. C, control (white bars); D, diabetic (black bars); C-TG, TG control (light gray bars); D-TG, diabetic TG mice (dark gray bars).

