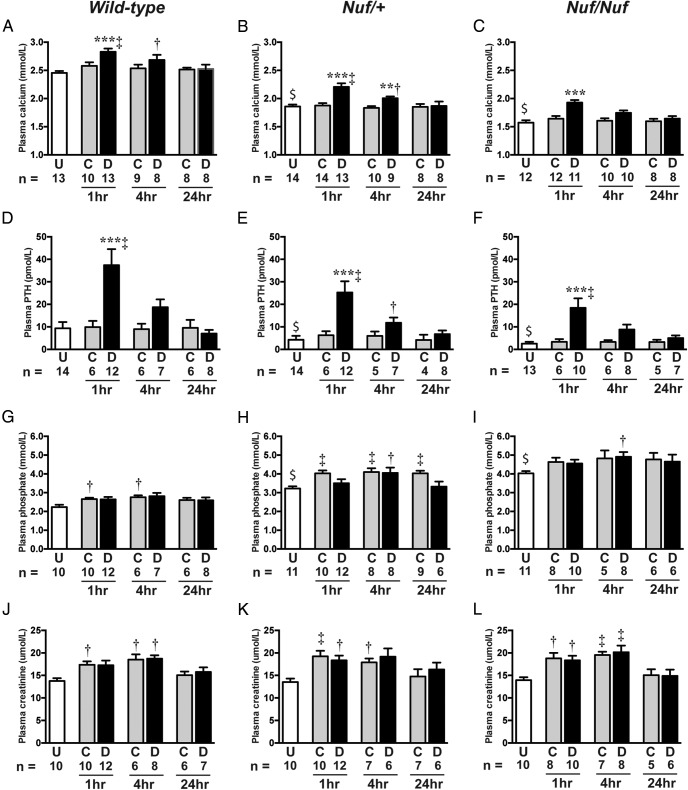
Figure 3.
Plasma adjusted calcium, PTH, phosphate, and creatinine concentrations after ip injection of either NPS 2143 or drug vehicle. Plasma concentrations of (A–C) adjusted calcium, (D–F) PTH, (G–I) phosphate, and (J–L) creatinine were measured in untreated (U) mice, or 1, 4, or 24 hours after mice were given an ip bolus injection of control (C) or drug (D) solutions (n = 4–14 for all groups). $, P < .001 for a comparison between untreated (U) Nuf/+ or Nuf/Nuf mice and respective untreated wild-type mice. **, P < .01 and ***, P < .001 for a comparison between respective wild-type, Nuf/+, or Nuf/Nuf mice given control (C) or drug (D) solutions. †, P < .05 and ‡, P < .01 for a comparison between wild-type, Nuf/+, or Nuf/Nuf mice given control (C) or drug (D) solutions and respective untreated (U) mice.

