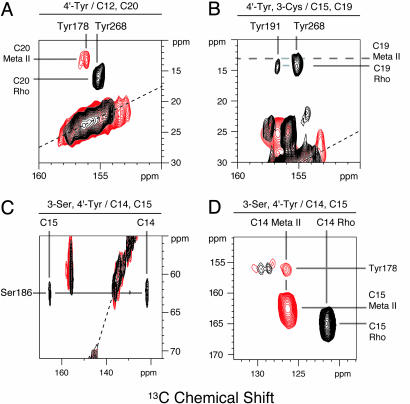
Fig. 4.
The 2D DARR NMR of rhodopsin and meta II. The expanded regions of the full 2D NMR spectra of rhodopsin (black) and meta II (red) shown contain cross peaks between the retinal and protein 13C-labels. The protein and retinal labels are as follows: 4′-13C tyrosine and 12, 20-13C retinal (A); 4′-13C tyrosine, 3-13C Cys and 15, 19-13C retinal (B); and 3-13C Ser, 4′-13C tyrosine and 14,15-13C retinal (C and D). The intense resonances along the dotted lines correspond to MAS side bands. The unlabeled cross peaks shown in B centered at 25 and 157 ppm correspond to cysteine–tyrosine correlations. The unlabeled cross peaks shown in C centered at 60 and 155 ppm correspond to serine–tyrosine correlations. The unlabeled cross peaks shown in D correspond to correlations between 4′-13C tyrosine and natural abundance 13C carbons on the tyrosine rings. The rhodopsin and meta II spectra were obtained at -80°C and a spinning speed of 10 kHz (A), 9.5 kHz (B), or 11 kHz (C and D). See the supporting information, which is published on the PNAS web site, for 1D MAS and full 2D DARR spectra.

