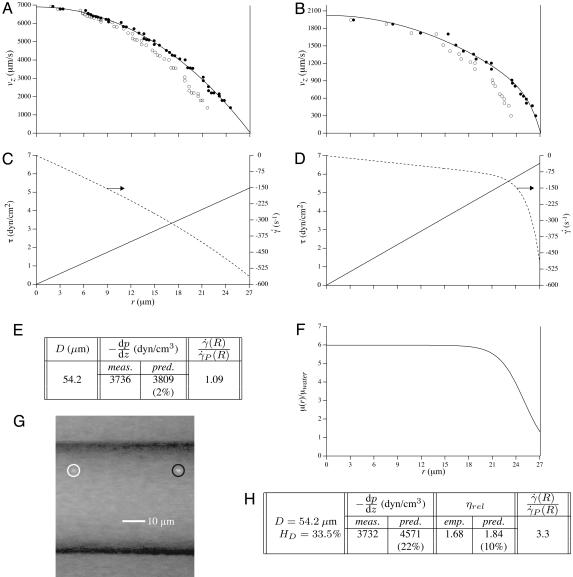
Fig. 1.
Optically corrected fluorescent (•) and raw (○) μ-PIV data obtained from a 54.2-μm-diameter glass tube steadily perfused with saline (A) and washed red cells suspended in plasma (B) (human blood, HD = 33.5%). Superimposed on the μ-PIV data in A and B are axisymmetric velocity distributions, vz(r), extracted from the data by following the methods described in ref. 20. (C and D) Distributions in shear rate (dashed curves, right axes) and shear stress (solid curves, left axes) over the tube cross section, corresponding to the velocity distributions shown in A and B.(F) Predicted distribution in the normalized viscosity, μ(r)/μwater, derived by using the analytical expression for μ(r) (see Supporting Text). (E and H) Geometric and rheological quantities associated with A and B, respectively, including the measured tube diameter, D, and discharge hematocrit, HD; the measured and predicted values of the axial pressure gradient, dp/dz; and the ratio of the predicted wall shear rate,  , to the wall shear rate,
  , of a Poiseuille flow, having the centerline velocities shown in A and B. Also tabulated in H are the empirically estimated (3) and predicted values of the relative apparent viscosity, ηrel. Percentages given in parentheses under each of the predicted values listed in the tables correspond to the percentage of difference between measured (or empirically estimated) and predicted values. (G) Bright-field image of the saline-perfused glass tube referenced in A showing dual images of one microsphere (upstream, white circle; downstream, black circle) separated in time by the double-flash interval.

