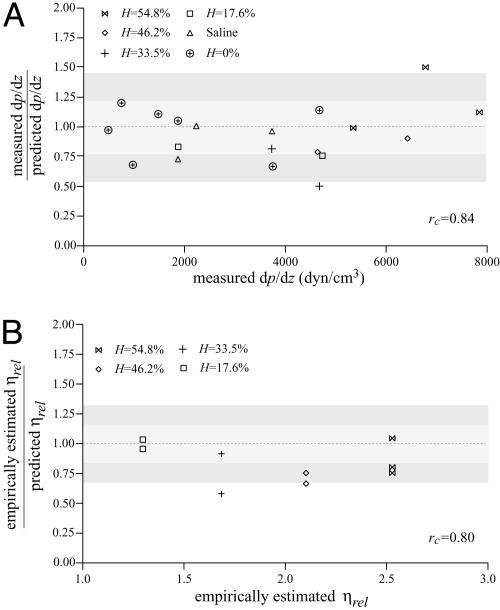
Fig. 2.
Predictability of dp/dz and ηrel by using microviscometric analysis of μ-PIV data obtained from glass capillary tubes in vitro. Ratio of the measured to predicted value of dp/dz versus the corresponding measured value (A) and ratio of the empirically estimated (3) to predicted value of ηrel versus the corresponding empirically estimated value (B). Predicted values were determined by applying the microviscometric method to the μ-PIV data obtained from the glass-tube experiments. The light and dark shaded regions span, respectively, one and two standard deviations in the distributions around unity. The standard deviation corresponds to 23% for dp/dz and 16% for ηrel. The correlation coefficient, rc, is shown for its corresponding predicted quantity.

