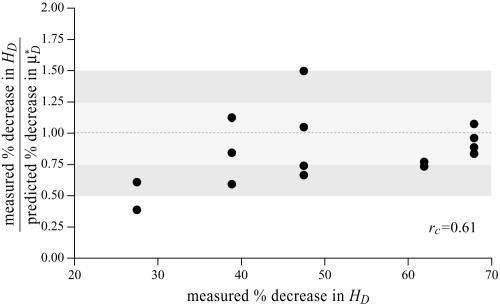
Fig. 4.
Ratio of the measured percentage of decrease in HD to the predicted percentage of decrease in  versus the corresponding measured percentage of decrease in HD. Predicted values were determined by applying Eq. 1 and the microviscometric method to the μ-PIV data obtained from the glass-tube experiments. The light and dark shaded regions span, respectively, one and two standard deviations in the distributions around unity, where the standard deviation corresponds to 25%. The correlation coefficient, rc, is 0.61.

