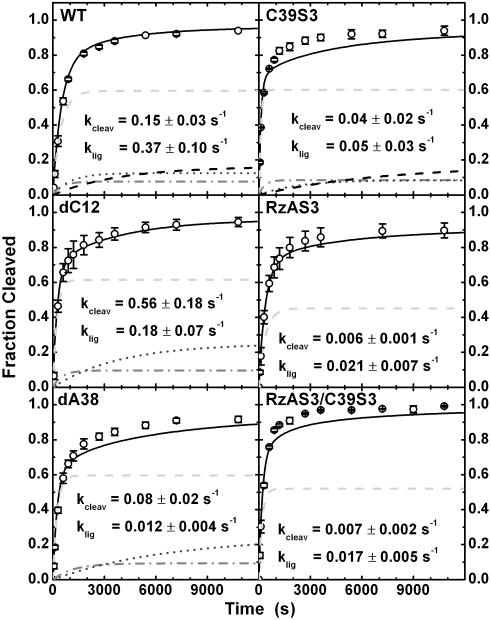
Fig. 3.
Experimental and simulated cleavage time courses of WT and variant ribozymes. Analytical kinetic simulations (black lines) are least-squares fits to the experimental data (open circles). The derived chemistry rate constants for cleavage and ligation vary significantly with the modification. The subpopulation contributions are also included (I, light gray dashed line; II, gray dash-dotted line; III, dark gray short-dashed line; IV, black dashed line), except for the many minor subpopulations of the RzAS3-containing variants.

