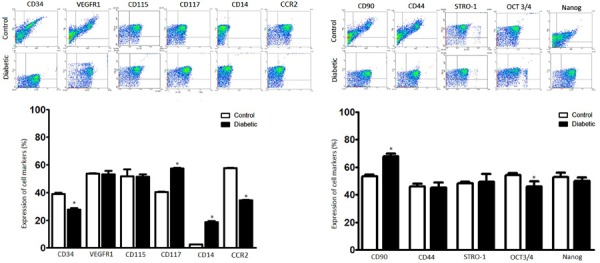
Figure 1. Representative flow cytometry plots of VYS cells from the control and diabetic groups. These were stained with markers for hematopoiesis (CD34, VEGFR1, CD117), monocytes/macrophages (CD115, CD14, CCR2), stromal tissue (CD90, CD44), and pluripotency (STRO-1, OCT3/4, Nanog). The expression of CD34, CCR2, and OCT3/4 was significantly reduced in the diabetic group. The histograms show the increased expression of CD90, CD117 and CD14 in the diabetic group compared with the control. Results are reported as the means±SE of cells collected from five yolk sacs per animal of the control (n=5) and diabetic groups (n=5) analyzed in duplicate. *P<0.05 (ANOVA and Tukey's multiple comparison test).

