Fig. 3.
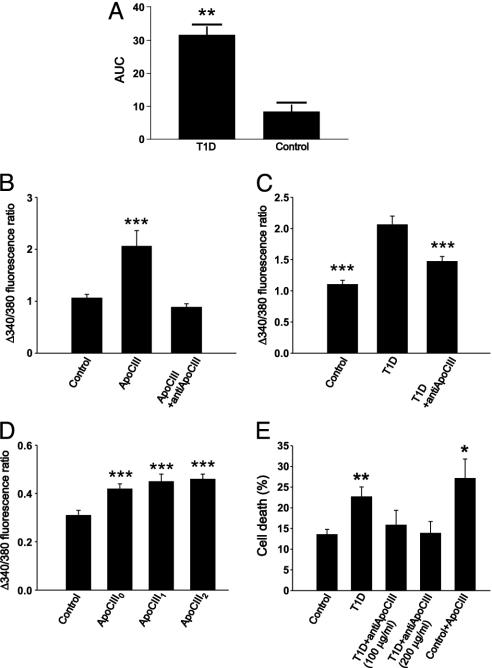
Amounts of apoCIII in T1D serum and effects on [Ca2+]i and cell death. (A) Relative levels of apoCIII1 + 2 in T1D and control serum, given as area under the curve (AUC). **, P < 0.01 (n = 5). (B) Pancreatic β cells were incubated with apoCIII or apoCIII plus antibodies against human apoCIII (n = 63, 35, and 33). ***, P < 0.001 versus control. (C) β cells were incubated with a control or a T1D serum and T1D serum plus anti-apoCIII (n = 18, 17, and 20). ***, P < 0.001 versus T1D serum. (D) Mouse β cells were incubated with apoCIII0, apoCIII1, apoCIII2, or vehicle (control; n = 54, 40, 48, and 37, respectively). ***, P < 0.001 versus control. (E) The insulin-secreting cell line RINm5F was exposed to control and T1D sera and T1D serum with the addition of two concentrations of anti-apoCIII, and finally control serum with apoCIII (n = 5). *, P < 0.05 and **, P < 0.01, versus control.

