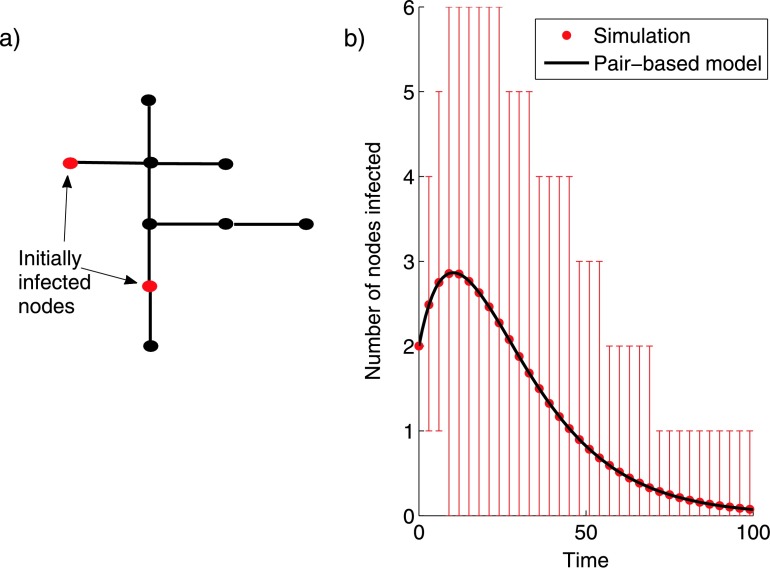
Fig. 1.
(a) An undirected tree indicating two nodes which we infect to initiate epidemics, with all other nodes initially susceptible. (b) The mean (dots) of 100,000 stochastic simulations on the network with transmission rate τ=0.1 across each link and removal rate γ=0.05 for each node, with error bars denoting the 5th and 95th percentiles plotted together with the solution of (3) (solid line) using the Matlab code published with Sharkey (2011)

