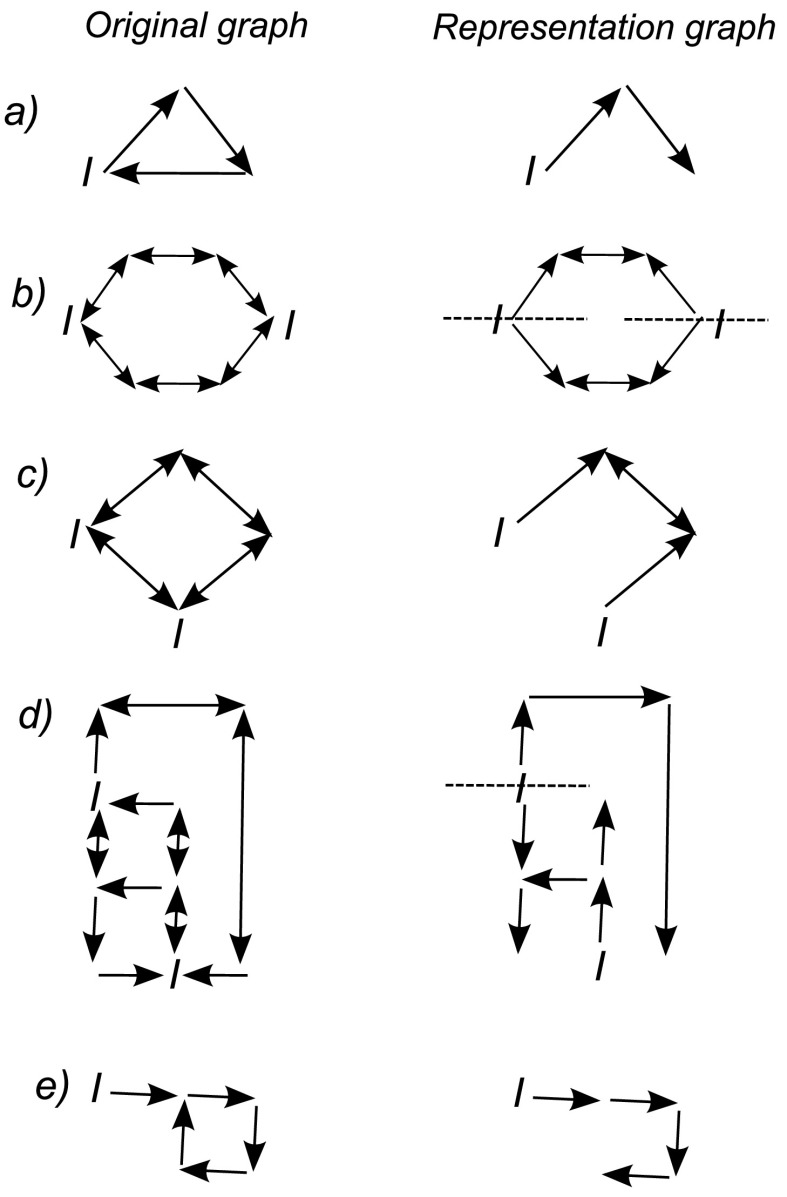
Fig. 7.
The graphs on the left are the initial transmission networks where the initially infected nodes are indicated by the symbol I. The graphs on the right are the reduced representation graphs where the cuts for independent segments which occur for cases (b) and (d) are indicated with dashed lines. The tree structure of the graphs on the right shows that applying the pair-based model to these graphs generates an exact representation of the infection dynamics on the original system

