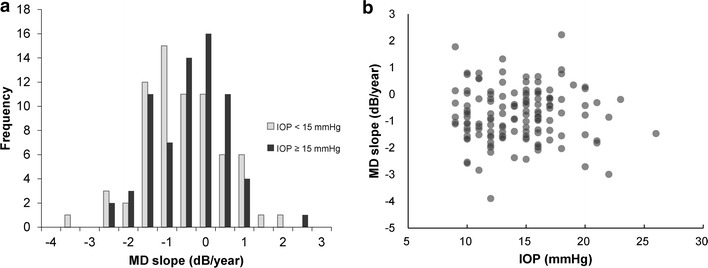
Fig. 4.

MD slopes in the low-IOP and high-IOP groups. a Histogram of MD slope in each group. Even with IOP <15 mmHg, 48 % of patients had progressive visual field defects with MD slope <−1.0 dB/year. In addition, 26 % of these patients had MD slope <−1.5 dB/year. b Scatter plot of IOP and MD slope. There was no significant correlation between treated IOP and MD slope (R2 = 0.00, P = 0.93)
