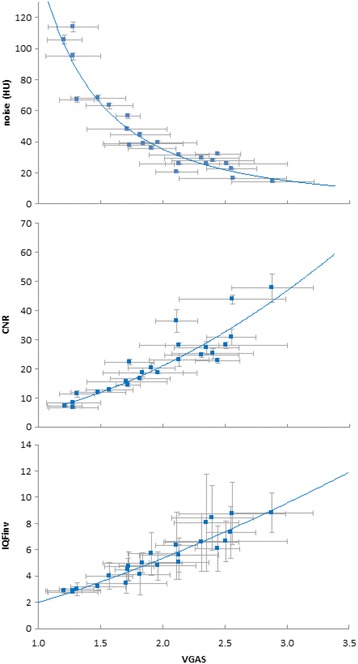
Fig. 3.

Mean noise, CNR and IQFinv versus mean VGAS. The error bars in the x direction represent the standard deviation between the scores of the different radiologists. For noise, the error bars in the y direction represent the standard deviation between noise measurements in 11 following slices in the Catphan uniformity module. For CNR, the error bars in the y direction represent the standard deviation between CNR measurements in four consecutive slices of the Catphan CT number linearity and CT number accuracy module. For IQFinv, the error bars in the y direction represent the standard deviation between the six readers of the contrast-detail module in the Catphan phantom. Regression lines were plotted resulting in an r2 of 0.90, 0.88 and 0.92, p < 0.001, for noise, CNR and IQFinv respectively
