
Fig. 2.
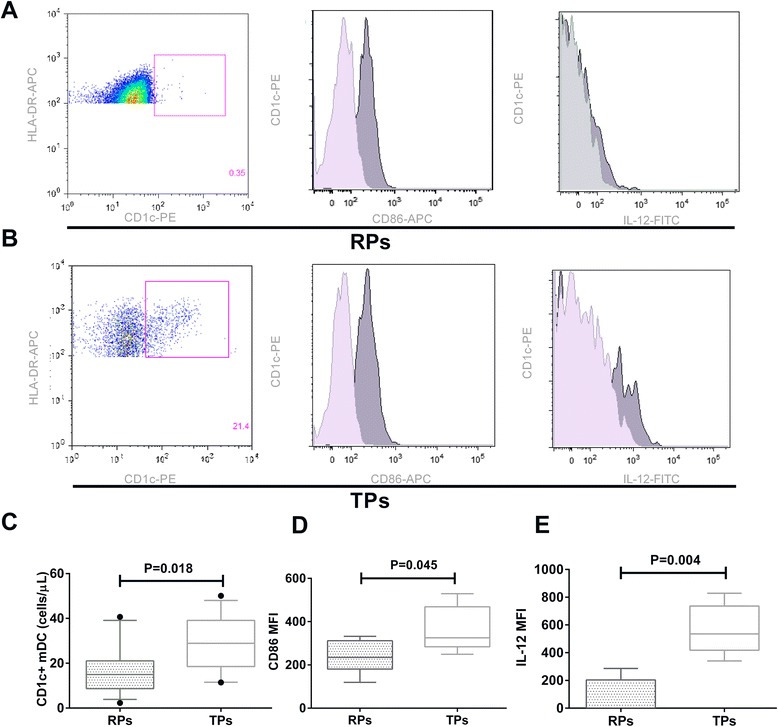
Abnormally low CD1c + mDC counts, CD86 expression, and IL-12 secretion in RPs compared with TPs. a Flow cytometry plots of CD1c + mDC counts, CD86 expression, and IL-12 secretion in RPs. Light gray histograms represented isotype control staining for CD86 expression or IL-12 secretion. b Flow cytometry plots of CD1c + mDC counts, CD86 expression, and IL-12 secretion in TPs. Light gray histograms represented isotype control staining for CD86 expression or IL-12 secretion. c CD1c + mDC counts in RPs and in TPs. d Expression of CD86 on CD1c + mDC in RPs compared with TPs. e Intracellular secretion of IL-12 in CD1c + mDCs from RPs and TPs after stimulation with R848