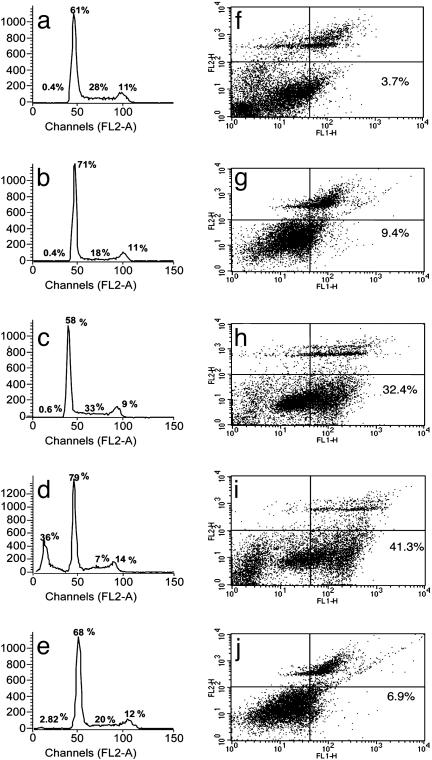
Fig. 4.
Cell-cycle progression and apoptosis in heregulin and NBD peptide-treated SKBr3 cells. Growth of cells and drug treatment conditions were the same as in Fig. 3. The fraction of cells in different phases of the cell cycle was measured by propidium iodide (PI) staining followed by FACS (Becton Dickinson) analysis. Cell-cycle distribution of cells grown in rich medium (a), in serum-free medium (b), in serum-free medium in the presence of heregulin (1 nM) (c), in serum-free medium in the presence of heregulin (1 nM) and WT NBD (100 μM) (d), and in serum-free medium in the presence of heregulin (1 nM) and mutant NBD (100 μM) (e). Numbers in each panel show the percent distribution of cycling cells (excluding the dead sub G0 population) in different phases under these treatment conditions. The apoptotic fraction of cells detected by annexin V staining after different treatments is shown, with numerals in the lower right-hand panel of each figure showing the annexin V-positive fraction (f–j). (f) Cells grown in serum-free medium in the presence of heregulin (1 nM). (g) Cells grown in serum-free medium in the presence of WT NBD (100 μM). (h and i) Cells grown in serum-free medium in the presence of heregulin (1 nM) and WT NBD at 50 μM (h) and 100 μM (i). (j) Treatment with the mutant NBD peptide at 100 M showed minimal or no effect. All treatments were for 18 h.

