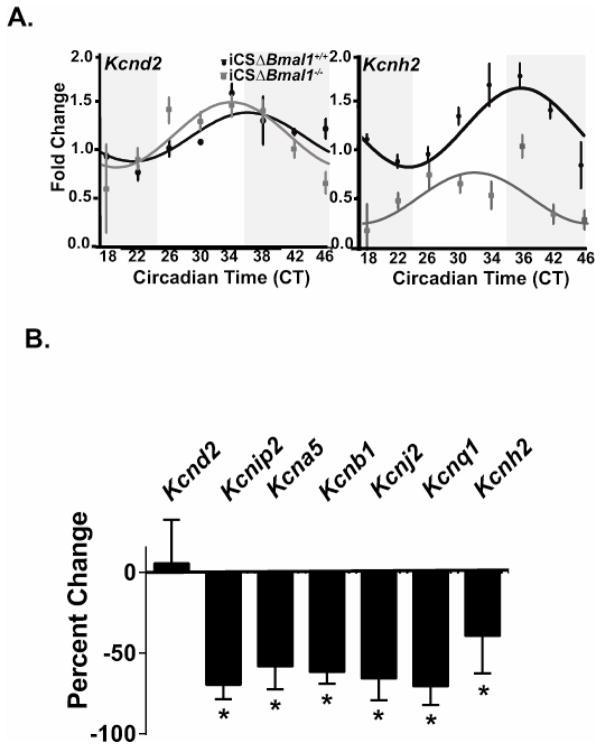
Figure 1. The cardiomyocyte molecular clock regulates the circadian expression of Kcnh2 transcripts as well as the expression of several K+ channel gene transcripts that are not circadian.
A) Shown are the JTK_CYCLE best fit data for the mRNA expression profiles for the K+ channel genes Kcnd2 and Kcnh2 from iCSΔBmal1+/+ (solid circles) and iCSΔBmal1−/− (grey squares) mouse hearts (n=3–4 animals per time point). The dark and light bars on the graph represent extrapolated subjective day and night as defined by Circadian Time (CT) according to the prior L:D cycle before release into DD. JTK_CYCLE statistics were used to determine if the expression pattern was circadian. The JTK_CYCLE calculated p value for Kcnd2 and Kcnh2 in the iCSΔBmal1+/+ mice is 0.003 and 7.02E-05 respectively, and the JTK_CYCLE calculate p value for Kcnd2 and Kcnh2 in the iCSΔBmal1−/− mice is 0.0095 and 0.060 respectively. Channels with JTK_CYCLE p values less than 0.05 were considered circadian in expression. B) Shown is the percent change in the mRNA transcript over a 24-hour period for Kcnd2, Kcnip2, Kcna5, Kncb1, Kcnj2, Kcnq1, and Kcnh2 in the iCSΔBmal1−/− mice compared to iCSΔBmal1+/+ mice.

