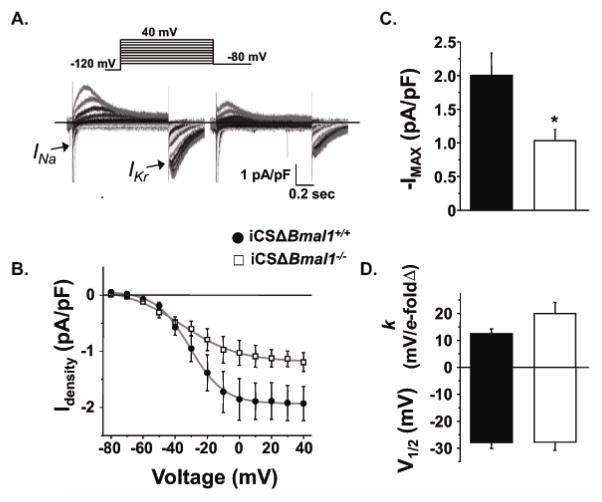
Figure 2. Disruption of BMAL1 signaling reduces IKr.
A) Shown are representative families of currents recorded from iCSΔBmal1+/+ or iCSΔBmal1−/− ventricular cardiomyocytes (isolated from mice after 58 hours in constant darkness). The currents were recorded by pre-pulsing cells from −80 to 40 mV in 10 mV increments, followed by a test-pulse to −80 mV. The peak INa measured during the initial pre-pulse is cropped for presentation purposes. B) The peak inward IKr measured during the test-pulse is plotted as a function of the pre-pulse potential and the data are described using a Boltzmann equation (grey line). C–D) The mean Boltzmann data from the fits to the individual cells for maximally activated IKr (IMAX, pA/pF), the slope factor (k, mV/e-fold change), and the midpoint potential for half-maximal activation (V1/2, mV) are shown for iCSΔBmal1+/+ (solid bars) and iCSΔBmal1−/− (open bars) mice (n=11–13 cells, *P<0.05).

