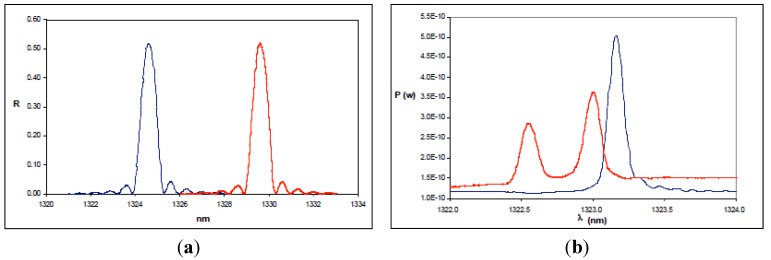
Figure 2.
(a) Ideal behavior of the reflected spectrum of an FBG subjected to a longitudinal strain; (b) Effect of a transverse stress on the reflected spectrum of the FBG. In all figures the blue line represents the non-perturbed spectrum of the FBG and the red one is the spectrum after the application of the load.

