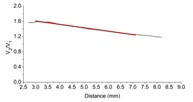
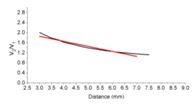
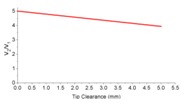
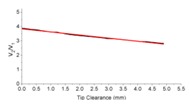
Table 1.
Characteristics of the different configurations of the TC sensor.
| Config. | 1st Sensor Configuration | 2nd Sensor Configuration | 3rd Sensor Configuration | 4th Sensor Configuration |
|---|---|---|---|---|
| Light source (Laser) | 7 mW 650 nm |
30 mW 650 nm |
30 mW 650 nm |
20 mW 650 nm |
| Optical fibers bundle | Multimode Øcore = 100 µm NA = 0.22 |
Scrambler + Multimode Øcore = 100 µm NA = 0.22 |
POF Øcore = 240 µm NA = 0.5 |
Single-mode illuminating fiber Øcore = 4.3 µm NA = 0.12 Multimode receiving fibers Øcore = 100 µm NA = 0.22 |
| Photodetectors gain | Symmetric gain G1 = G2 = 0.75 × 10⁴ V/A |
Asymmetric gain G1 = 0.75 × 10⁵ V/A G2 = 2.38 × 10⁵ V/A |
Asymmetric gain G1 = 0.75 × 10⁵ V/A G2 = 2.38 × 10⁵ V/A |
Asymmetric gain G1 = 0.75 × 10⁵ V/A G2 = 2.38 × 10⁵ V/A |
| Calibration curve |
 V2/V1 = −0.089d + 1.8783 |
 V2/V1 = −0.2002d + 2.4578 |
 V2/V1 = −0.213d + 5.0064 |
 V2/V1 = −0.2167d + 3.8448 |
| Cross section of the common leg |  |
 |
 |
 |
| Laboratory precision | 141 µm | 51 µm | 33 µm | 24 µm |
| Wind tunnel precision | 24 µm | - | 25 µm | 28 µm |
