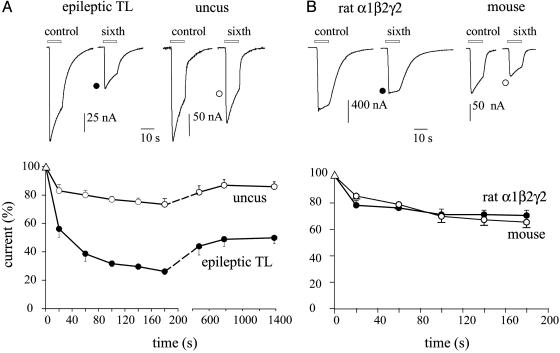
Fig. 1.
GABA currents recorded from oocytes. (A Upper) Sample currents in response to the first and sixth GABA applications, from oocytes injected with membranes isolated from the indicated brain regions. TL tissue was from patient 4 (see Table 1). (Lower) Time course of GABA-current run-down. Points represent mean current amplitudes (±SEM) from 8–12 oocytes (four frogs; one patient); normalized to Imax: -177 ± 16 nA (○); -107 ± 13 nA (•). (B) Sample currents (Upper) and run-down (Lower) from oocytes injected with rat GABAA-receptor subunit cDNAs (•) or with TL mouse membranes (○). Currents were normalized to Imax = -1.3 ± 0.2 μA (•) and -161 ± 14 nA (○). Number of oocytes, 7–12 (five frogs).

