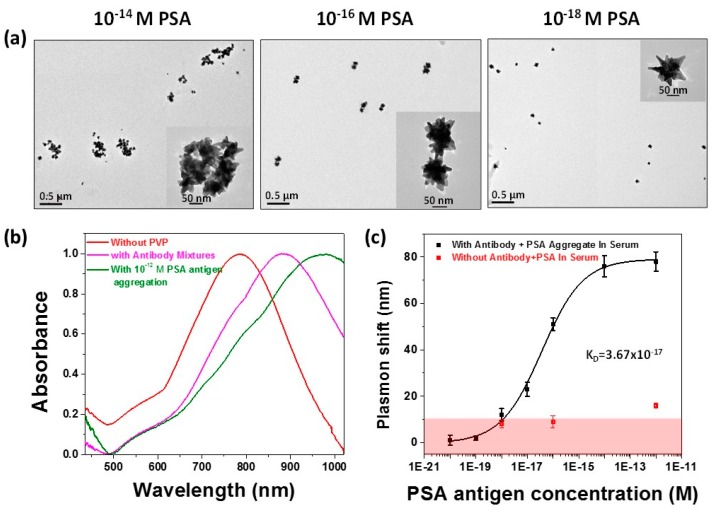
Figure 2.
Biosensing using an aggregation assay with PSA protein in serum. Transmission electron microscopy data show a systematic trend of increasing nanostar aggregation with increasing concentrations of PSA, which gives rise to large shifts in the LSPR frequency, (a). Raw UV-Vis spectra of the treated nanostars, mixture of antibody-coated nanostars without PSA, and a saturating concentration of PSA revealing shifts as large as 180 nm, (b). The binding curve of PSA induced aggregation of antibody-coated nanostars, (c) The pink region depicts non-specific binding measured by mixing different concentrations of PSA with nanostars containing no antibody. The binding constant obtained from fitting the data to a single-site model indicates extremely tight binding and a limit of detection of 10−18 M PSA [47].

