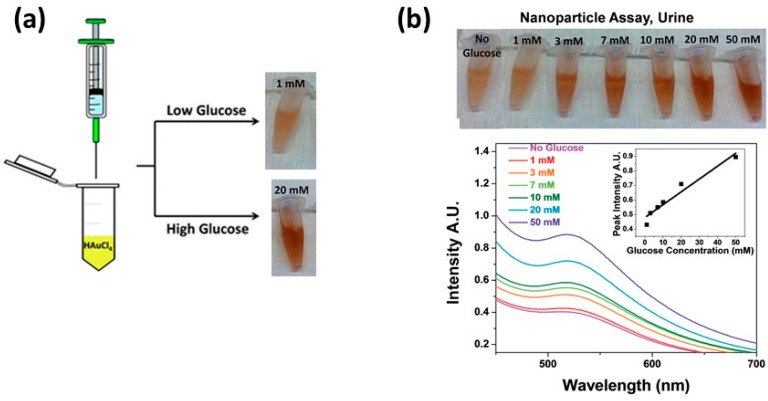
Figure 7.
A schematic for glucose detection through nanoparticle formation, (a) that was tested in whole urine samples spiked with glucose; (b) As the samples were heated under alkaline conditions, there was a colorimetric increase in intensity with increasing concentrations of glucose [151].

