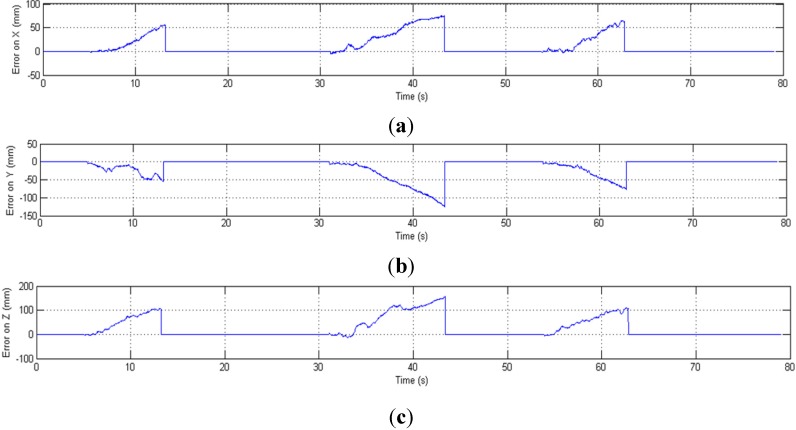
Figure 14.
Position error (mm) in three-axes versus time; error increases in cases of full OTS occlusion (times corresponding to dashed red lines in Figure 13). (a) Error of position on X-axis; (b) Error of position on Y-axis; (c) Error of position on Z-axis.

