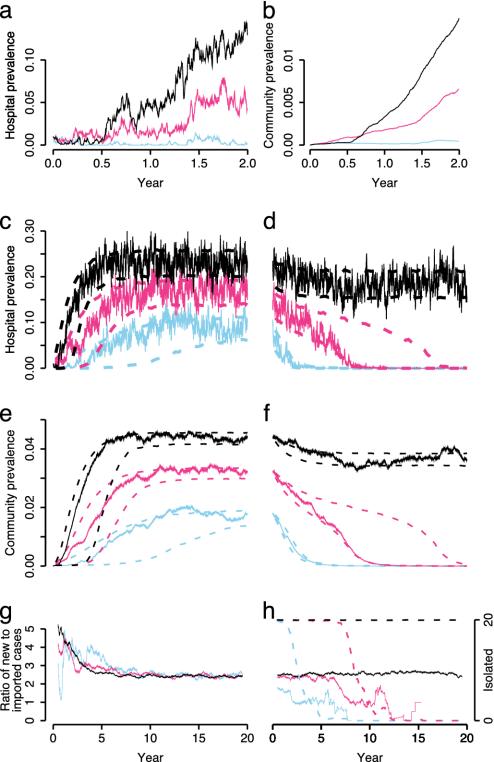
Fig. 2.
Simulation output from the stochastic model with three R0 values: 1.1 (blue); 1.2 (red); and 1.3 (black). Respective RA values are 0.77, 0.85, and 0.92. (a) Hospital prevalence over 2 years. Ten hospitalized patients were initially colonized with MRSA. (b) Corresponding community prevalence. (c) The same simulation runs over 20 years (solid lines). Dashed lines indicate 10th and 90th percentiles calculated from 1,000 simulations conditioning on fadeout (i.e., extinction of the epidemic) not occurring (40, 16, and 9% of simulations faded out by chance for R0 values of 1.1, 1.2, and 1.3, respectively). (d) Hospital prevalence after opening a 20-bed IU starting from the endemic level reached in c. Dashed lines indicate 10th and 90th percentiles from 1,000 simulations. (e and f) Community prevalence corresponding to c and d. (g and h) Ratio of new hospital-acquired to imported cases corresponding to single runs in c and d (1 year moving average). Dashed lines in h shows the number of isolated patients (1 year moving average).

