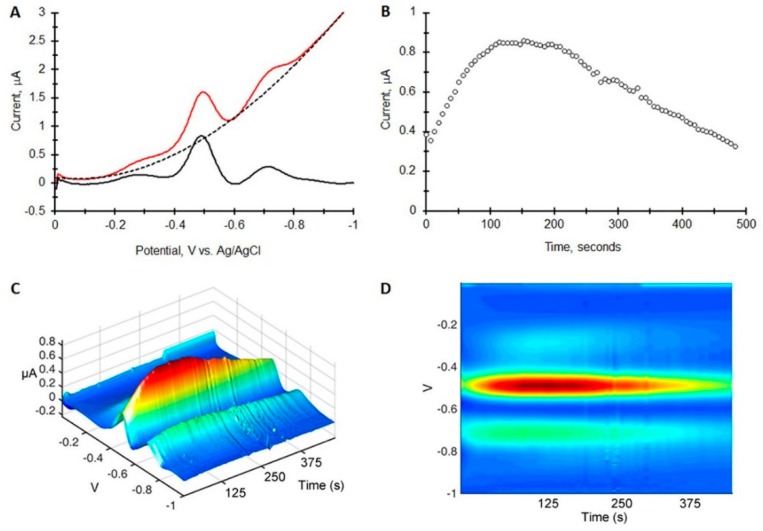
Figure 2.
Square wave chromato-voltammogram of 1 µg of TNT on a paper-based electrochemical probe with its edge placed in 200 µL of an ethylene glycol/choline chloride 2:1 molar mixture. Square wave parameters are amplitude = 25 mV, frequency = 60 Hz. (A) A square wave voltammogram at the peak maximum in time showing the polynomial background subtraction (dotted line); (B) Current measured at Ipc vs. scan number; (C,D) 3 dimensional representations of the same square wave chromato-voltammogram.

