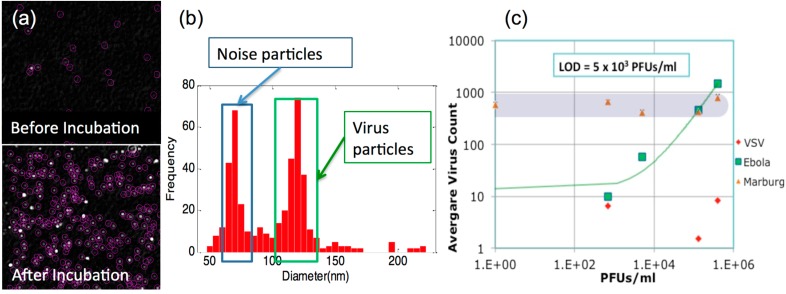
Figure 8.
In virus detection experiments, by comparing particles found within the expected virus size range for pre- and post-incubation images (a) bound on the specific antibody spot, individual virions can be identified and counted. A histogram of virus sizes (b) is identified in each image. A size filter is chosen to remove background (noise) particles. (c) A typical dilution curve for Ebola VSV pseudotype concentration is shown with an LOD of 5 × 10³ pfu/mL in serum containing other viruses and bacteria (106 cfu/mL E. coli K12 and 105 pfu/mL of Marburg VSV pseudotypes). (Reused with permission from [12]).

