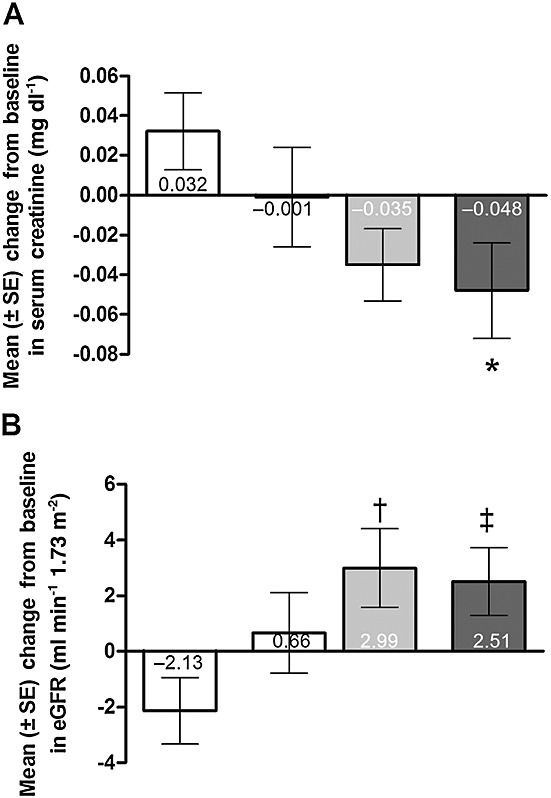
Figure 2.

Mean (± SE) change from baseline to SUPER-1 final visit in (A) serum creatinine and (B) estimated glomerular filtration rate (eGFR). *P = 0.032 vs. placebo, least squares mean difference. †P = 0.009 and ‡P = 0.016 vs. placebo, least squares mean difference using analysis of covariance with treatment as the factor and baseline value as the covariate. For the purposes of conversion, 0.02 mg dl–1 is equivalent to 1.76 µmol l–1 sCr.  , placebo (n = 70);
  , sildenafil 20 mg three times daily (n = 67);
  , sildenafil 40 mg three times daily (n = 65);
  , sildenafil 80 mg three times daily (n = 68)
