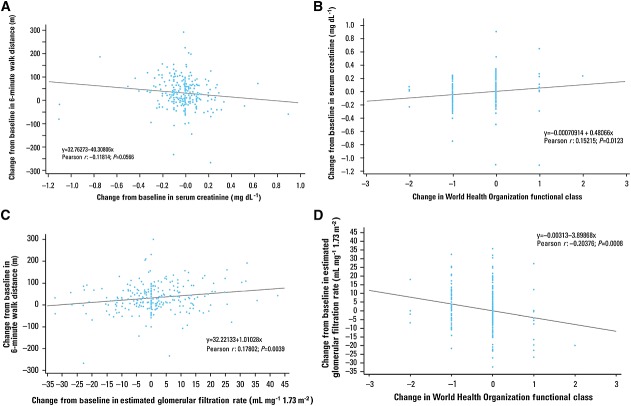
Figure 3.
Correlations between change from baseline in serum creatinine and change from baseline in (A) 6-min walk distance and (B) World Health Organization functional class. Correlation between change from baseline in estimated glomerular filtration rate and change from baseline in (C) 6-min walk distance and (D) World Health Organization functional class. For the purposes of conversion, 0.02 mg dl–1 is equivalent to 1.76 µmol l–1 sCr

