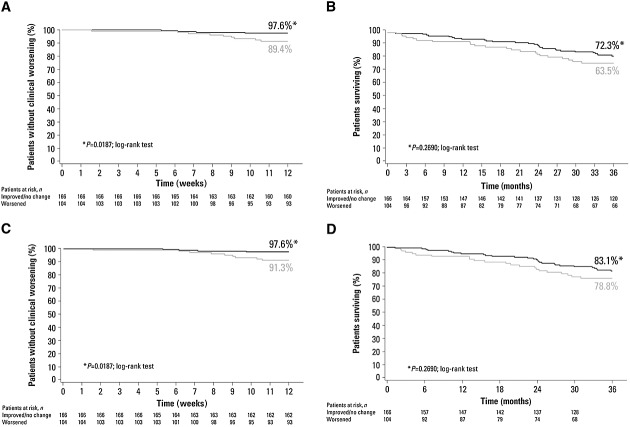
Figure 4.
Kaplan–Meier analysis of (A) time to clinical worsening and (B) time to all-cause mortality by serum creatinine (sCr) status from baseline to week 12; (C) time to clinical worsening and (D) time to all-cause mortality by change in estimated glomerular filtration rate (eGFR) status from baseline to week 12. A–B  , patients with no change or improvement in sCr;
  , patients with worsening sCr. C–D
  , patients with no change or improvement in eGFR;
  , patients with worsening eGFR.

