Figure 2.

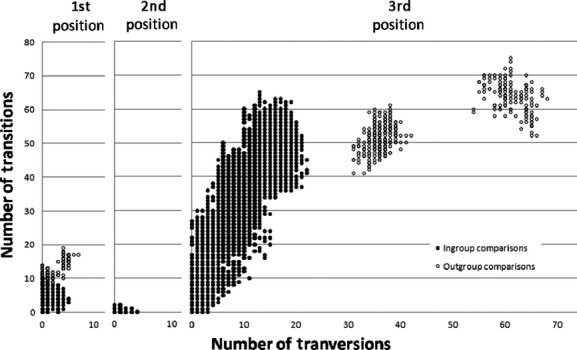
Visual depiction of evolutionary rates across the three codon positions, as shown by plotting the number of transitions versus the number of transversions for all pairwise comparisons in the 161 sequence alignment.

Visual depiction of evolutionary rates across the three codon positions, as shown by plotting the number of transitions versus the number of transversions for all pairwise comparisons in the 161 sequence alignment.