Table 2.
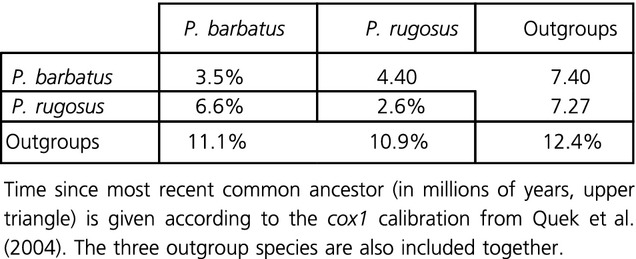
Average uncorrected pairwise distances within (center diagonal) and between (lower triangle) each mtDNA species subtree.

Average uncorrected pairwise distances within (center diagonal) and between (lower triangle) each mtDNA species subtree.
