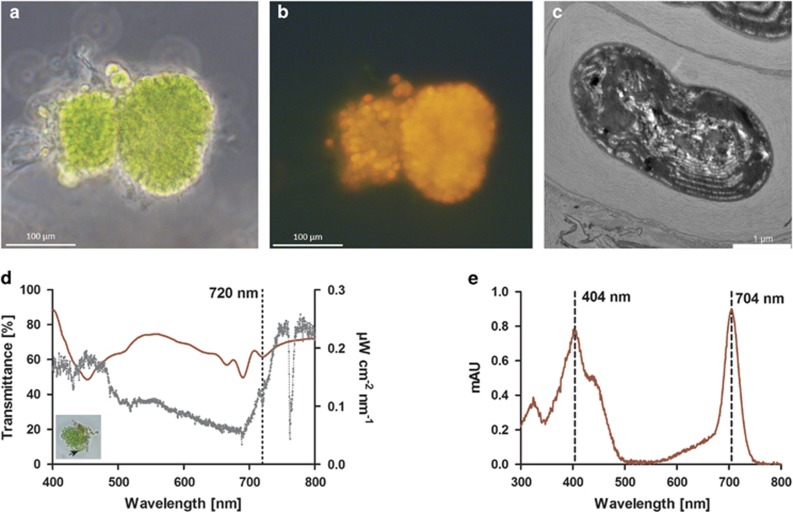
Figure 1.
Imaging and pigment analysis of Chl f-containing cyanobacteria isolated from a cavernous low-light environment. (a) Representative bright field microscope image of cultured cells grown under 720 nm NIR. (b) Fluorescence image of the same cells as in a, excited at 450–490 nm, with emission being detected at >510 nm. (c) Transmission electron microscopy of a Chl f-containing cyanobacterium with densely stacked thylakoid membranes. (d) Transmittance spectrum of cell aggregate determined by hyperspectral imaging (red line). Ambient light conditions at the site of isolation (gray line), as measured by a spectroradiometer. Note the Chl f-specific in vivo absorption at ∼720 nm in the transmittance spectrum (dotted line). Small insert picture denotes the cells and area of interest (black arrow) from which the spectrum was taken. (e) In vitro absorption spectrum of Chl f extracted from enrichment cultures and analyzed via high-performance liquid chromatography. The two Chl f-specific absorption peaks (404 and 704 nm in acetone:MeOH solvent) are indicated.

