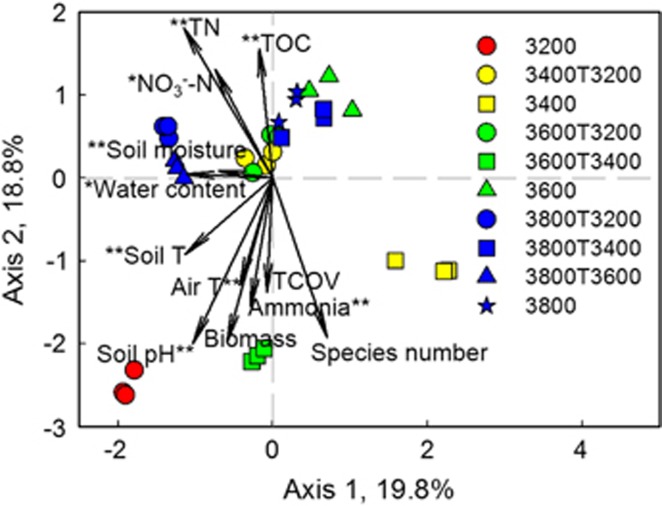
Figure 3.
Linkages between microbial community and environmental variables. Canonical correspondence analysis (CCA) displayed microbial community (symbols) and environmental variables (arrows). The value of the axis is the variance percentage explained for the axis. The significance of each environmental variable was calculated by ANOVA. **P<0.01, *P<0.05. T, temperature; TOC, total soil organic C; TN, total soil N; TCOV, total coverage of vegetation.

