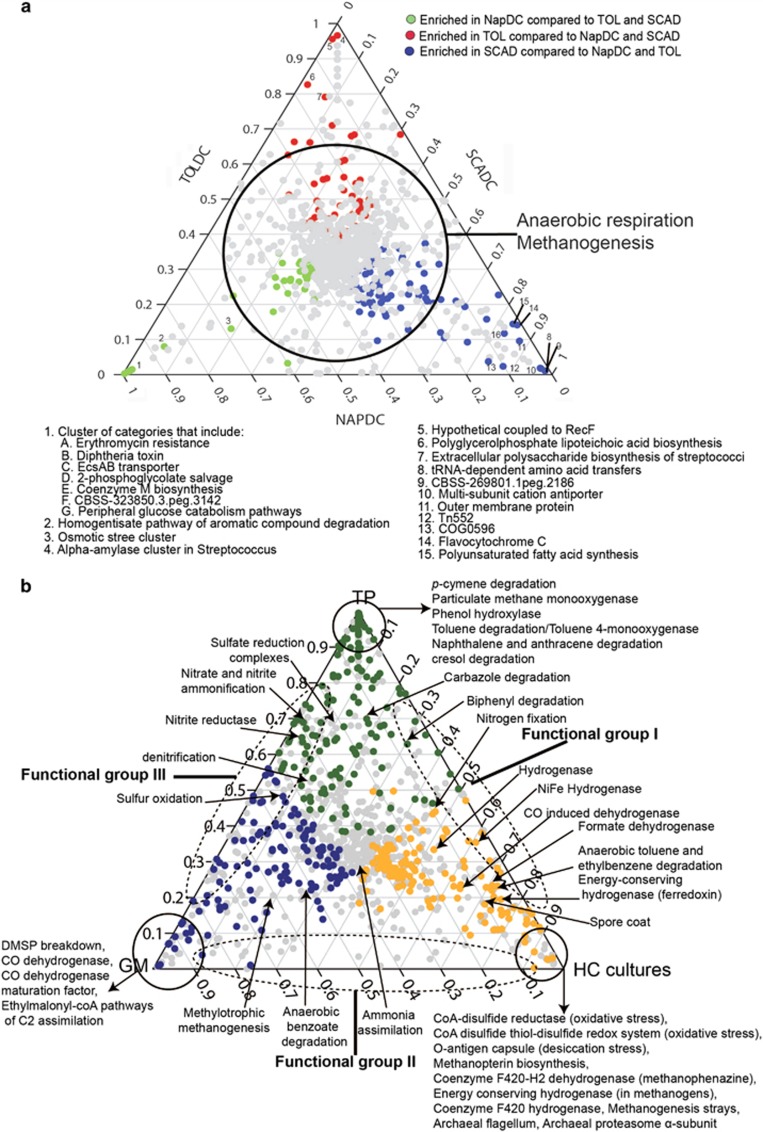
Figure 4.
Ternary plots showing three-way comparisons of functional categories in SEED subsystems level 3 shared among individual metagenomes or groups of metagenomes. (a) Comparison of individual NAPDC, SCADC and TOLDC metagenomes. (b) Comparison of metagenome groups from hydrocarbon-impacted communities: HC (TOLDC, SCADC and NAPDC); GM (three metagenomes from Gulf of Mexico deep marine sediments); and TP (two metagenomes from oil sands tailings ponds). Each point on the ternary plot represents a subsystem category in the three metagenomes or groups of metagenomes, with the proportion of each SEED being normalized to a value of 1. Data points are colored according to the source of each metagenome or group; gray dots represent functional categories present at low, statistically non-significant (P<0.01) abundance. Points located near the vertices are enriched within the metagenome or group associated with that vertex, points along each axis are shared only between the two vertices associated with that axis (labelled as Functional Groups I, II and III in b), and points located near the center of the plot have similar proportions in all three metagenomes or groups (that is, show no specific enrichment; Hug et al., 2012).

