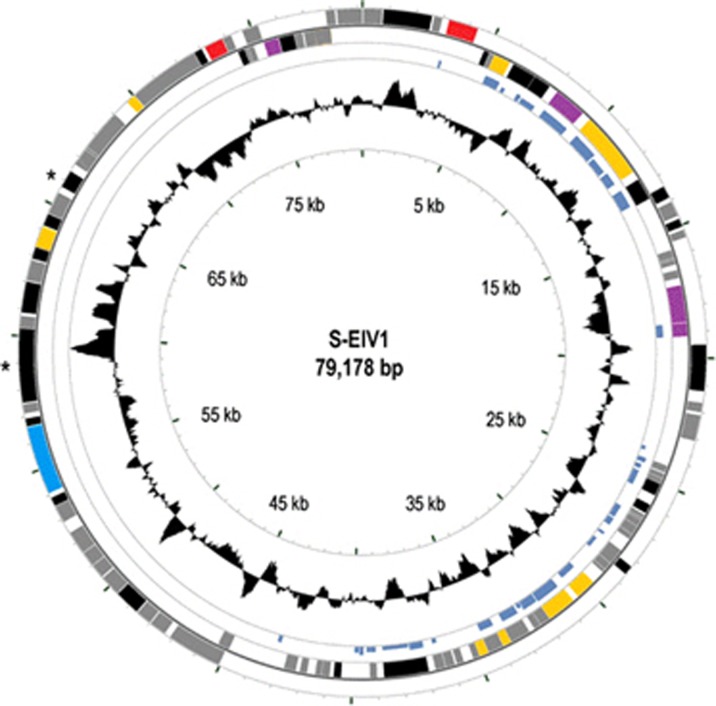
Figure 3.
Genomic map of S-EIV1. Circles from outmost to innermost correspond to (i) predicted ORFs (BLASTp, nr database, e-value>0.0001) on forward strand and (ii) reverse strand; (iii) tBLASTx hits (e-value>0.0001) against the fosmid MEDDCM-OCT-S04-C348 (the height of the bar is proportional to the e-value) and (iv) GC content plotted relative to the genomic mean of 46.2% G+C. Only ORFs >200 bp are shown and are colored as follows: red, lysis/lysogeny; gray, no homolog; black, hypothetical proteins; purple, host-derived genes; yellow, DNA metabolism and replication. *Indicates structural genes that were identified by SDS–PAGE.

