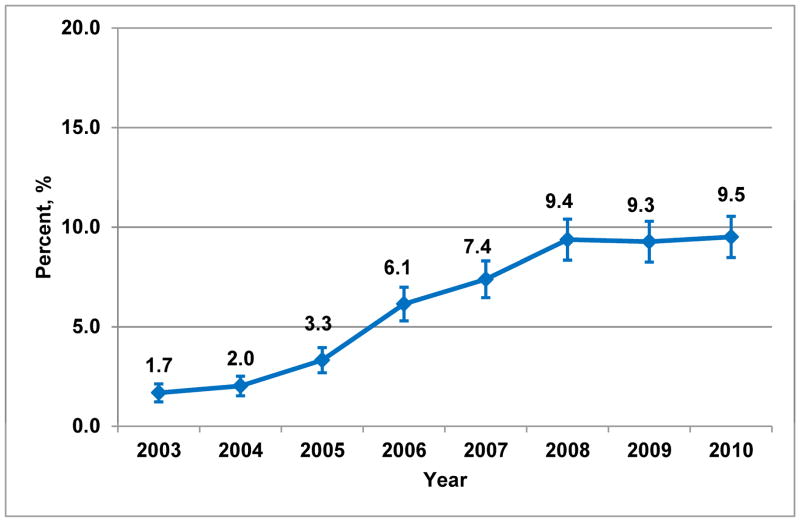
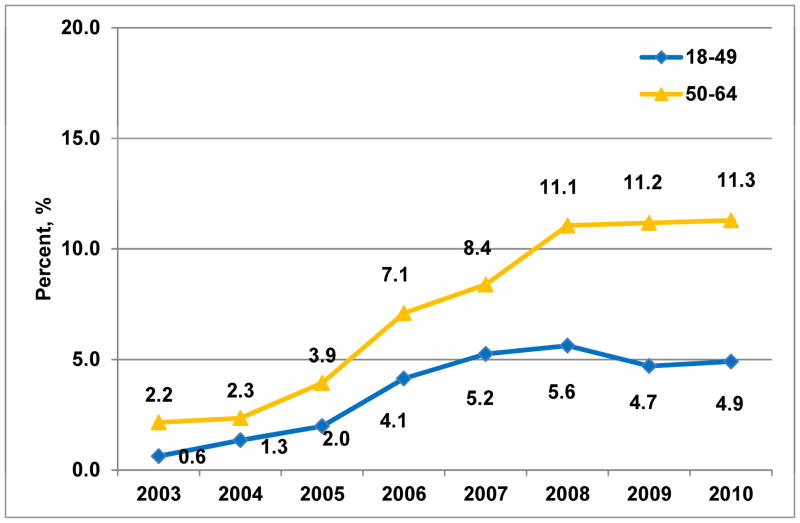
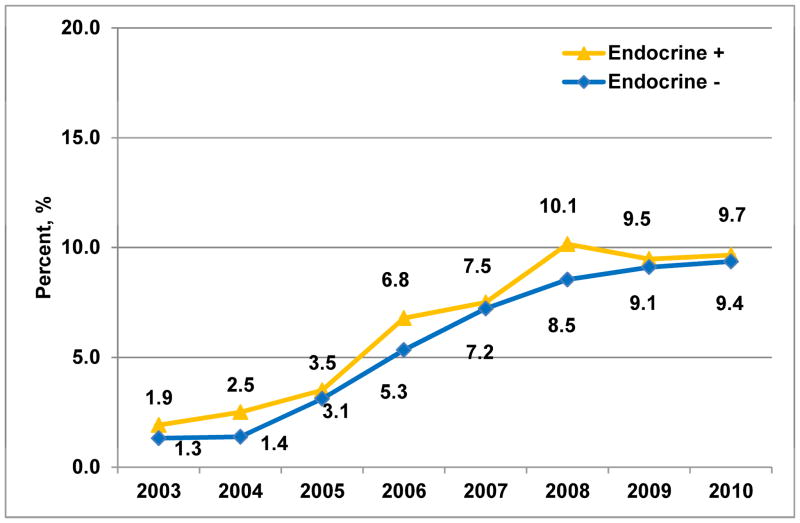
Figure 1. Temporal trends in brachytherapy use between 2003 and 2010.
A. Entire sample (Ptrend<0.001)
B. Stratified by age group (Ptrend<0.001)
C. Stratified by endocrine therapy status (Ptrend<0.001)
Percentages of brachytherapy use are standardized by region to account for variation in the geographic distribution of the MarketScan® cohort over time. Error bars in panel A indicate 95% confidence intervals around point estimate.


