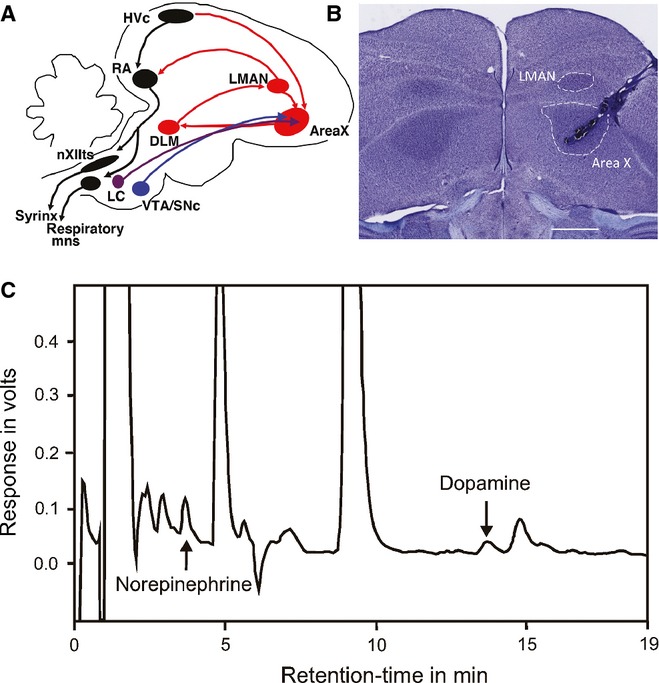
Figure 1.

(A) Schematic representation of important song-related circuits in the zebra finch brain, including catecholaminergic projections (in purple and blue) to the anterior forebrain pathway (AFP), in red. HVC, letter-based proper name; RA, robust nucleus of the arcopallium; nXIIts, cranial nerve XII; LC, locus coeruleus; VTA/SNc, ventral tegmental area/substantia nigra pars compacta; DLM, dorsolateral nucleus of the medial thalamus; LMAN, lateral magnocellular nucleus of the anterior nidopallium. (B) Photomicrograph of representative coronal section of male zebra finch brain, illustrating location of microdialysis probe. Note that placement of probe avoids damage to LMAN. Image obtained on a Nikon Eclipse E800 microscope, with 2× objective and 10× ocular, captured with Zeiss AxioCamMRc5 and Axiovision 4.4 software. Scale bar = 1 mm. (C) Representative chromatogram for a single microdialysis sample collected from Area X of an adult zebra finch. Signal amplitude (in volts) is plotted on the y-axis and retention time (in minutes) is plotted on the x-axis. NE and DA peaks are designated with arrows. A clear separation from interfering peaks is apparent for both NE and DA.
