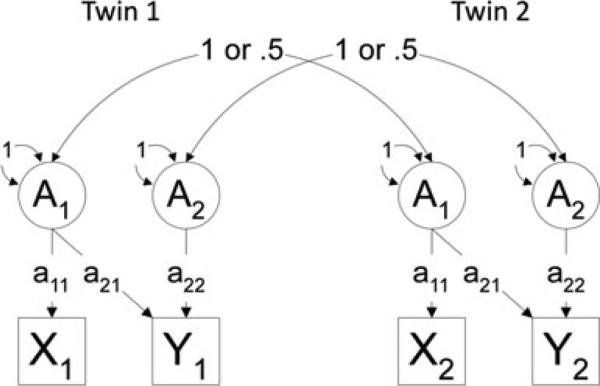
Figure 1.
Diagram depicting a bivariate Cholesky decomposition of the additive genetic component. A1 represents the additive genetic component for phenotype 1 and A2 represents the additive genetic component for phenotype 2 measured for twin 1 and twin 2. X1 represents phenotype 1 and Y1 represents pheno-type 2. A1 for Twin 1 and Twin 2 correlate 1 for MZ twins and 0.5 for DZ twins. Path estimate a21 reflects the additive genetic contribution of phenotype 1 on phenotype 2.

