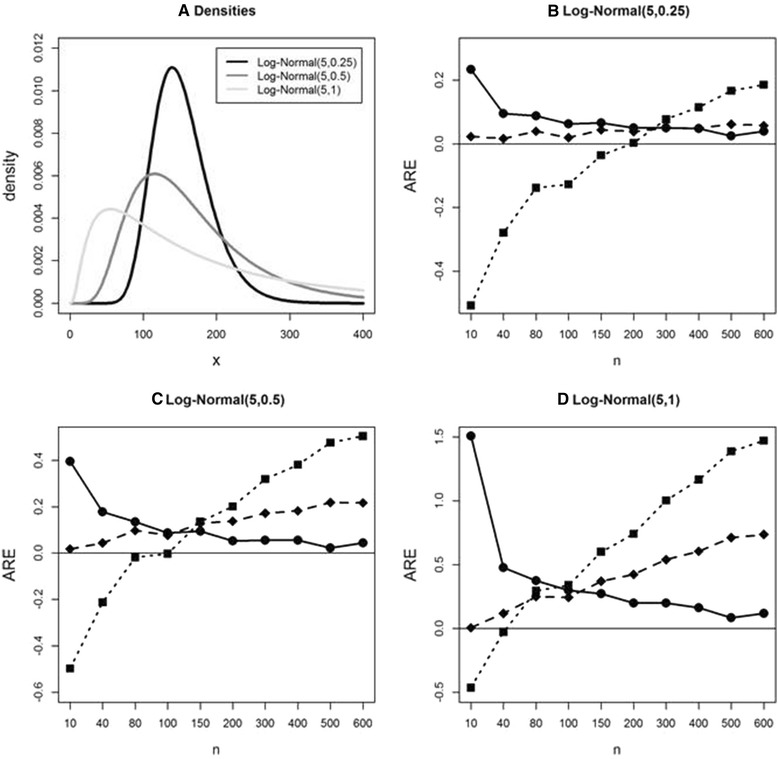
Fig. 2.

Average relative error (ARE) comparison in estimating sample standard deviation under S2 using simulated data from log-normal distributions. a: Density plots for 3 log-normal distributions. b, c, d: AREs for 3 methods using simulated data from the same 3 log-normal distributions. Bland (solid square with dotted line), Wan et al. (solid diamond with dashed line), and ABC (solid circle with solid line) methods
