Fig. 4.

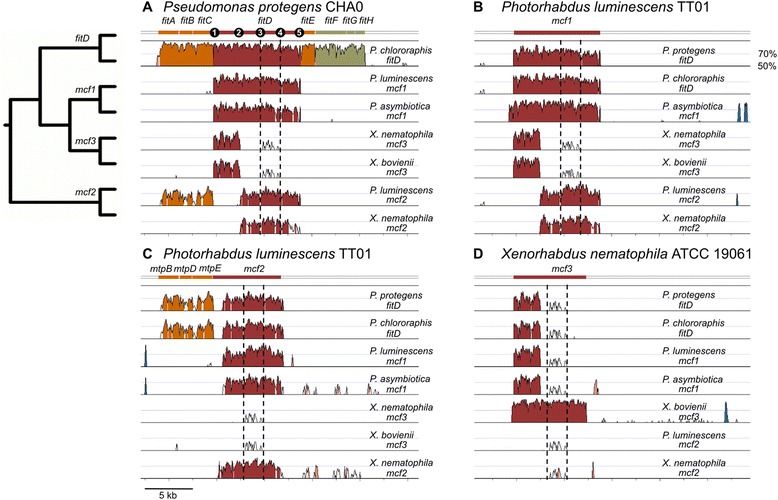
Similarity plot Fit and Mcf toxin encoding genomic regions in Pseudomonas, Photorhabdus and Xenorhabdus species. The alignment was conducted using LAGAN as implemented in mVISTA [59] with the respective reference sequence of (a) P. protegens CHA0 fitD, (b) P. luminescens TT01 mcf1 (c) Photorhabdus luminescens TT01 mcf2 and (d) X. nematophila ATCC 19061 mcf. The peaks and valleys graphs represent percent conservation between aligned sequences at a given coordinate on the reference sequence. Regions of high conservation (≥70 %) are colored according to the coding region of the reference sequences in dark red for toxin genes, in orange for transport genes and in green for regulation genes. Regions of high conservation not related to the cluster sequence are colored in pink. Regions colored in blue have high similarity to transposable elements and are only present adjunct to mcf genes in Xenorhabdus and Photorhabdus. Dotted lines mark the region encoding the TcdA/TcdB pore forming domain. Nucleotide key positions discussed in the text are indicated with numbers 1-5 in Fig. 1a for fitD: 1 = site 1; 2 = site 2707; 3 = site 4849; 4 = site 6831; 5 = site 9015. The plot shown of each alignment ranges between 50 % and 100 % identity calculated on a 100 bp window
