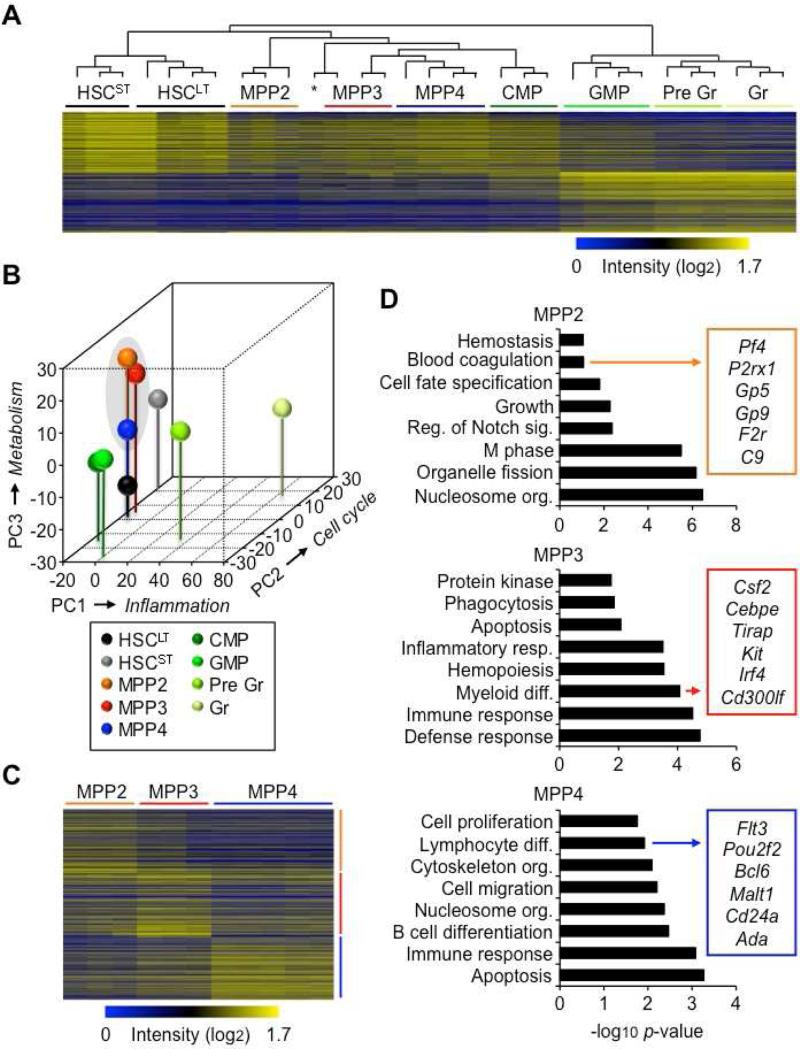
Figure 4. Molecular biases in MPP subsets.
(A) Hierarchical clustering analysis based on the 1000 most highly expressed genes in HSCLT and GM lineage-committed cells (GMP, Gr precursors: pre Gr; Gr). * Indicates one MPP4 sample clustering independently.
(B) Principal component (PC) analysis of the microarray results shown in (A). Axis labels indicate the primary gene signature driving each PC separation.
(C) Individual gene signatures representing the 1000 most highly expressed genes in MPP2, MPP3 and MPP4 relative to the other two populations.
(D) Gene ontology (GO) analyses of the gene signatures shown in (C).

