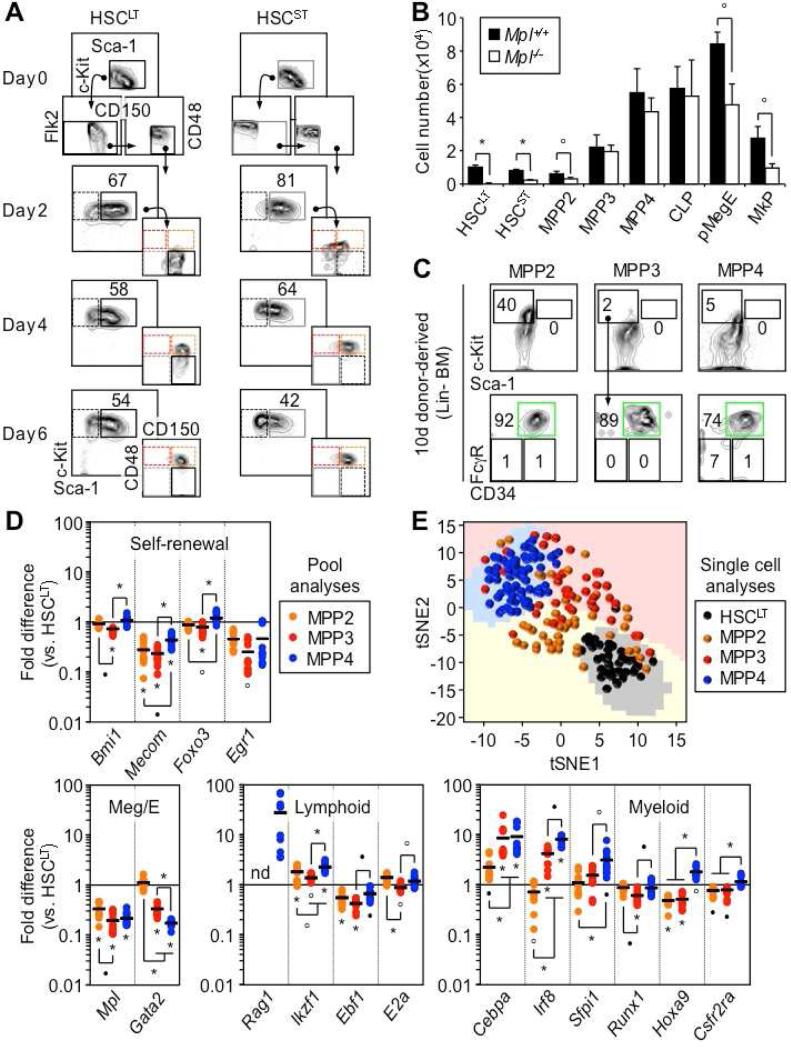
Figure 5. Hierarchical organization and molecular priming.
(A) Differentiation in vitro. Representative FACS plots showing HSCLT and HSCST differentiation kinetics in myeloid conditions (n = 2).
(B) Size of the indicated BM populations in Mpl−/− and littermate control mice (3 mice/group).
(C) Differentiation in vivo. Representative FACS plots of LSK and myeloid progenitor output 10 days following transplantation of 5,000 cells of the indicated donor population (3 mice/group).
(D) Fluidigm gene expression analyses at steady state. Results are expressed as mean (bar) and individual fold differences compared to HSCLT (8-12 pools of 100 cells /population; nd: not detectable).
(E) t-distributed stochastic neighbor embedding (tSNE) analysis of Fluidigm gene expression data acquired from single cells (30-58 cells/population).
Results are expressed as mean ± SD; op < 0.05, •p < 0.01, *p < 0.001.
See also Figures S4 and S5.

