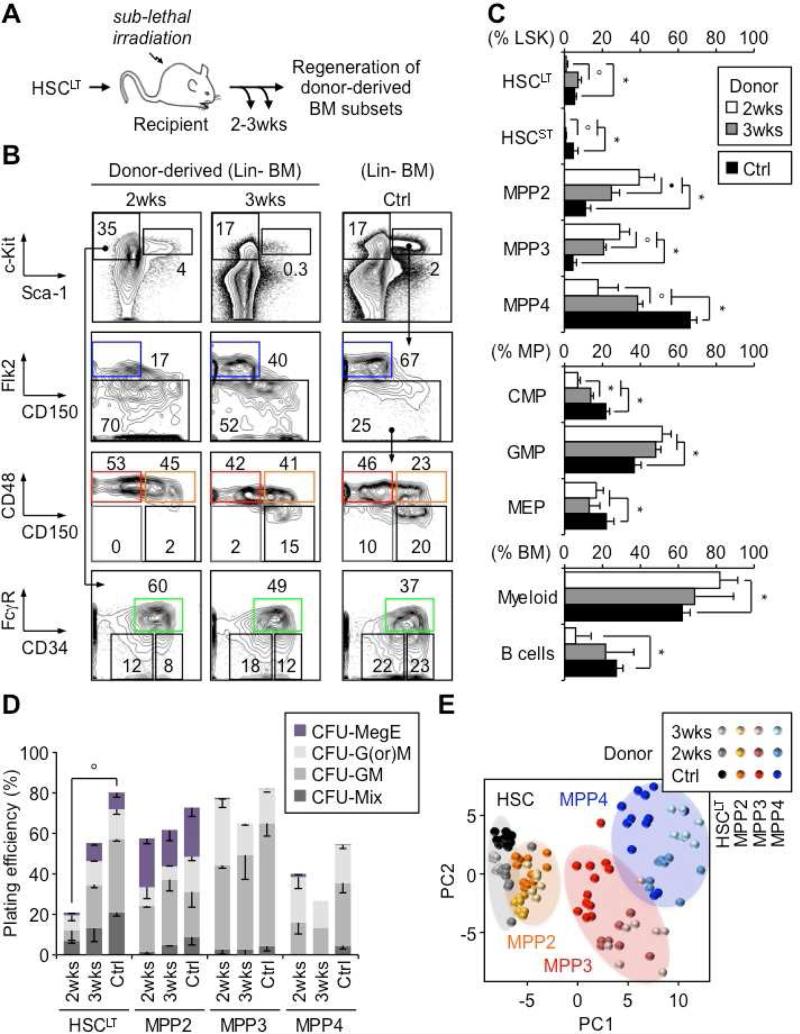
Figure 6. Contribution to blood regeneration.
(A) Experimental scheme for in vivo blood regeneration experiments. Donor HSCLT were transplanted into sub-lethally irradiated congenic recipients (2,000 HSCLT/mouse) and regeneration of donor BM subsets was followed at 2 and 3 weeks post-transplantation and compared to steady state control (Ctrl) mice.
(B) Representative FACS plots of regenerating BM subsets.
(C) Frequency of the indicated BM subsets (6-10 mice/group).
(D) Methylcellulose clonogenic assays for the indicated populations (n = 1-4)
(E) PC analysis of Fluidigm gene expression data from the indicated populations (8-12 pools of 100 cells/condition).
Results are expressed as mean ± SD or SEM (D); op < 0.05, •p < 0.01, *p < 0.001.
See also Figure S5, S6.

