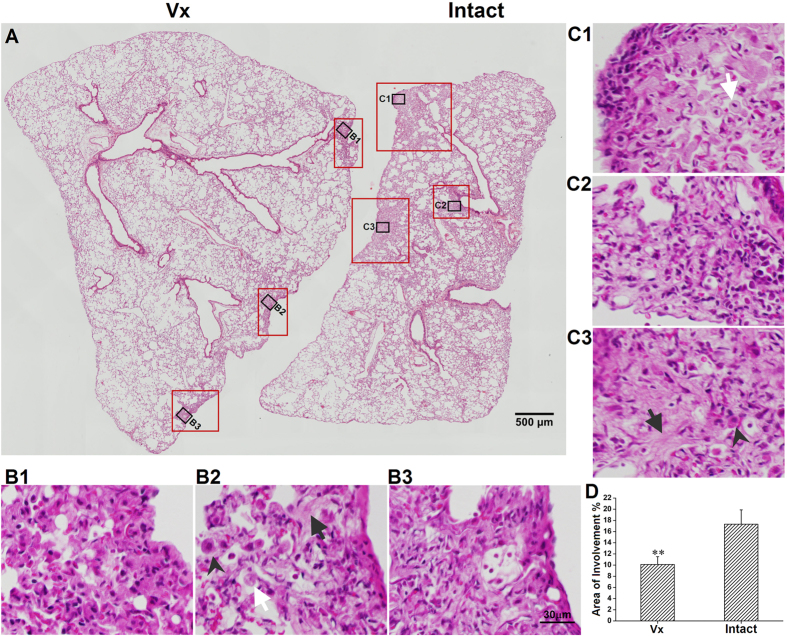
Figure 4. Evaluation of lung parenchyma lesions following bleomycin challenge by H&E stain.
(A), gross view. (B1,B2,B3) and (C1,C2,C3), represented high power visual field of area of involvement, showing detailed consolidation in fibrotic areas from the intact right and denervated left lungs, respectively. Arrow shows young collagen, white arrow shows macrophage, arrow head shows the type II alveolar epithelial cell. (D) morphometric analysis shows that percent consolidation area was more in the intact lung than the denervated lung. Vx: vagotomy. **P < 0.01, n = 24.

