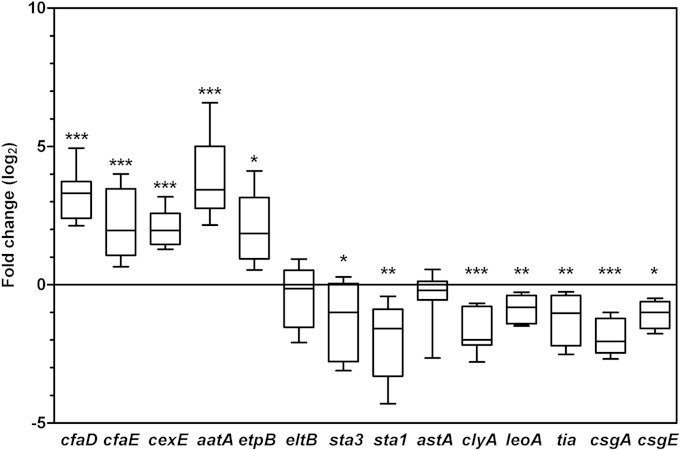
FIG 3.
Effect of iron starvation on ETEC virulence gene expression. Gene expression analysis of ETEC H10407 was performed in early stationary phase (5 h) in CFA medium alone or treated with 50 μM deferoxamine. Data are represented as the fold change ratio of expression in treated versus untreated cultures, calculated from relative expression values using the 2−ΔΔCT method. Values are log2 transformed. The median is indicated as a band within the box plot. Whiskers represent minimum and maximum values. Statistical analyses were performed using the one-sample t test. *, P < 0.05; **, P < 0.01; ***, P < 0.001.

