Figure 4.

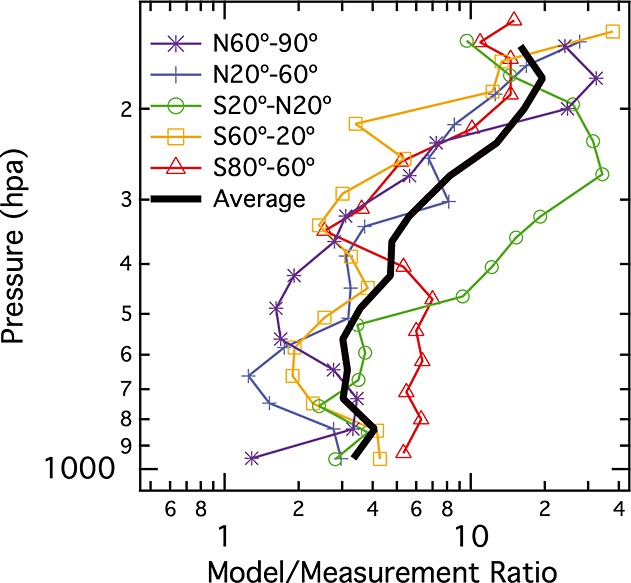
The ratio of the modeled to measured vertical BC profiles for individual latitude bands (colored lines) and averaged overall latitudes (black line). These results are averaged over all seasons/HIPPO series.

The ratio of the modeled to measured vertical BC profiles for individual latitude bands (colored lines) and averaged overall latitudes (black line). These results are averaged over all seasons/HIPPO series.