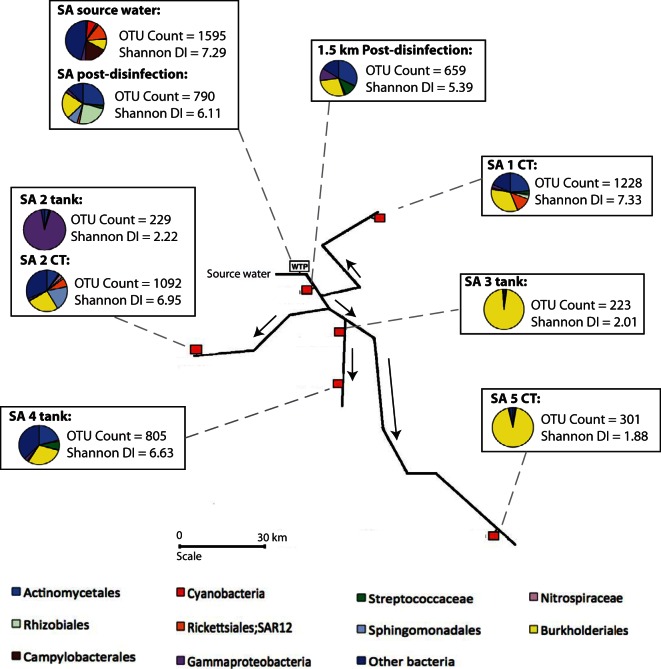
FIG 2.
A diagram of the bacterial diversity within the SA DWDS, including pie charts that depict the 11 most prolific bacterial taxa. WTP, water treatment plant; CT, customer tap. Red squares indicate sample collection points. The SA system utilizes river water as the source and uses a four-stage treatment process, followed by ultraviolet (UV) and monochloramine disinfection.

